A financial model is a structured and dynamic tool which links inputs/assumptions with periodic cash flow to produce results used for investment decisions or recommendations. They are mathematical models designed to represent a simplified version of a financial asset’s performance. Financial models ‘model’ or replicate real life financial issues based on assumptions so outputs are usually estimates since we cannot predict the future. Therefore, you need to be cautious when entering inputs as entering the wrong values or values which do not make financial sense will greatly affect your results as well as your investment decisions.
Some best practices in financial modelling include:
– 1 formula per row or column
– No hardcoding
– No more than 4 IF functions
Real Estate Investment Model
There are so many different types of financial models and depending on what you’re modelling whether debt, investments, valuations or mergers and acquisitions, the level of detail may be different for each however, the three main parts of a model fundamental to any financial analysis include:
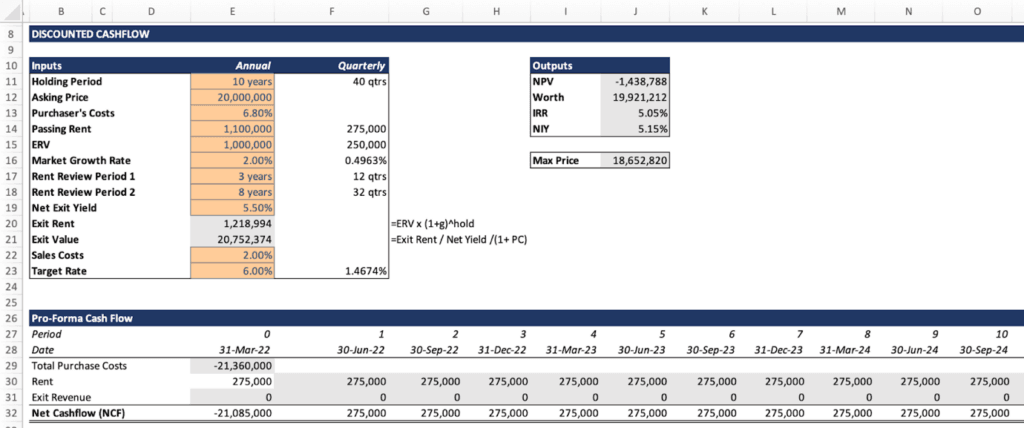
Summary / Inputs
This section is where you record all your inputs and / or assumptions. This is the most important part of any financial model as any changes made here will have an impact on your calculations as well as your results/outputs. To easily identify inputs in a financial model and avoid any confusion, it is good practice to have all inputs in a different font colour (the standard is to use blue, but you can use any colour you like so far as this is made clear to whoever is reading). For example, for an investment model such as the one above, our internal rate of return, net present value and the worth or the maximum price we’ll be willing to pay for the asset will depend on inputs / assumptions such as the holding period, purchaser’s costs, rent, market growth rate etc.
Cash Flow
If financial models were blogs, we would refer to this as the body (see what we did there…?). This section is where we have all the calculations. It is a detailed periodic (monthly, quarterly or annually) representation of all inflow (revenue) and outflow (costs) of cash by taking into consideration assumptions from the input section such as growth rates and purchaser’s costs to give us the net cash flow (sum of cash inflow and outflow). From our investment model, which has been structured with quarterly cash flows, the purchase cost, which is a one-off cost, only occurred in period ‘0’ and this value is negative because it indicates cash outflow (cost). Other costs associated with investments include operating costs and maintenance costs. The tenant is responsible for the maintenance and repairs if it’s a Full Repairing and Insuring (FRI) lease. The rent on the other hand represents a recurring inflow of cash so we leave this as a positive number.
Outputs
The output section shows the results from the calculation of cash flow. This is the part where most investors are interested in because it helps with decision making and investment recommendations. The Internal Rate of Return (IRR) is used to determine how profitable an investment is and it is the rate at which Net Present Value (NPV) is 0. This means that an investment with an IRR which results in a negative NPV is considered a bad investment. Based on the IRR, NPV and other outputs such as the Net Initial Yield (NIY) which is the ratio between the passing rent and the purchase price and the worth which is the maximum price (including purchaser’s cost) an investor is willing to pay for the asset, an investor can decide to either make the investment or consider an alternative which may have better returns. From our investment model, we need the Maximum price (The worth of the asset excluding purchaser’s cost) which is £18,652,820 to achieve an IRR of 6%. On the other hand, buying the asset at the asking price of £20m gives us a negative NPV, a lower IRR of 5.05% compared to the target rate and a Net Initial Yield of 5.15% so we don’t make the investment.
Conclusion
A financial model is a mathematical representation of financial issues which links inputs to the cash flow to produce outputs which help determine investment decisions and the financial performance of assets. The rule of thumb for decision making at the asking price is if:
IRR > Target Rate, NPV > 0 and Worth > Purchase Price => Good investment
IRR = Target Rate, NPV = 0 and Worth = Purchase Price => Good investment
IRR < Target Rate, NPV < 0 and Worth < Purchase Price => Bad investment